Team tickets and asking questions for Meeting C++ 2025
Two news items for Meeting C++ 2025, introducing team tickets and adding questions to the ticket ordering process to know your t-shirt size and more.
New Team Tickets for Meeting C++ 2025
by Jens Weller
From the article:
I'd like to make it easier to send your team to Meeting C++ 2025 with offering a team ticket.
I can't really break with the 1:1 relation between a ticket and its attendee, but I can offer a ticket...
Asking questions with the tickets for Meeting C++ 2025
by Jens Weller
From the article:
There is an update I've made to the tickets for this year, adding Questions that you may answer when registering for Meeting C++ 2025.
This years conference keeps me busy right now, but I quickly wanted to bring you an update on the ticktes. For the first time Meeting C++ includes a few questions with the registration for attendees. This way we get more accurate data on, but also for the attendees...
 Registration is now open for CppCon 2025! The conference starts on September 15 and will be held
  Registration is now open for CppCon 2025! The conference starts on September 15 and will be held
  Modern C++ offers a variety of ways to work with key-value data structures like
  Registration is now open for CppCon 2025! The conference starts on September 15 and will be held
  Using ranges or algorithms has several advantages over raw loops, notably readability. On the other hand, as we’ve just seen, sheer performance is not necessarily among those advantages. Using ranges can be slightly slower than a raw loop version. But that’s not necessarily a problem, it really depends on your use case. Most probably it won’t make a bit difference.
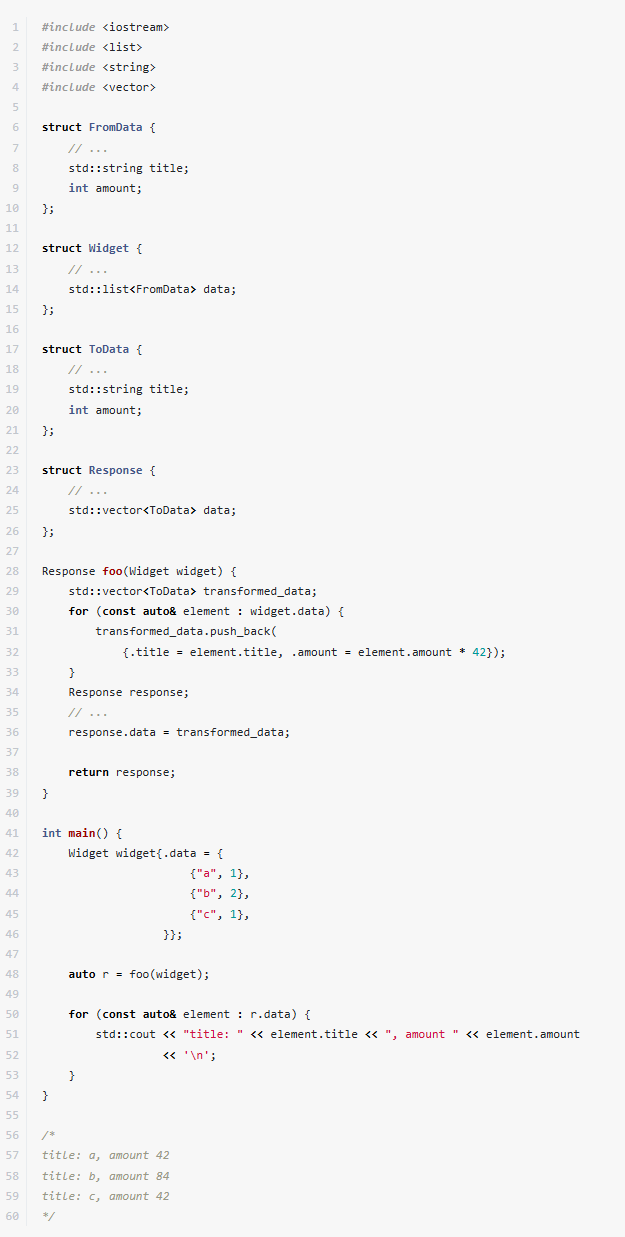
 Registration is now open for CppCon 2025! The conference starts on September 13 and will be held