Clang provides a few options to generate timing report. Among them, -ftime-report and -ftime-trace can be used to analyze the performance of Clang's internal passes. This post focuses on the traditional -ftime-report, which uses a line-based textual format.
Understanding and Improving Clang -ftime-report
by Fangrui Song
From the article:
The output consists of information about multiple timer groups. The last group spans the largest interval and encompasses timing data from other groups.
Up to Clang 19, the last group is called "Clang front-end time report". You would see something like the following.
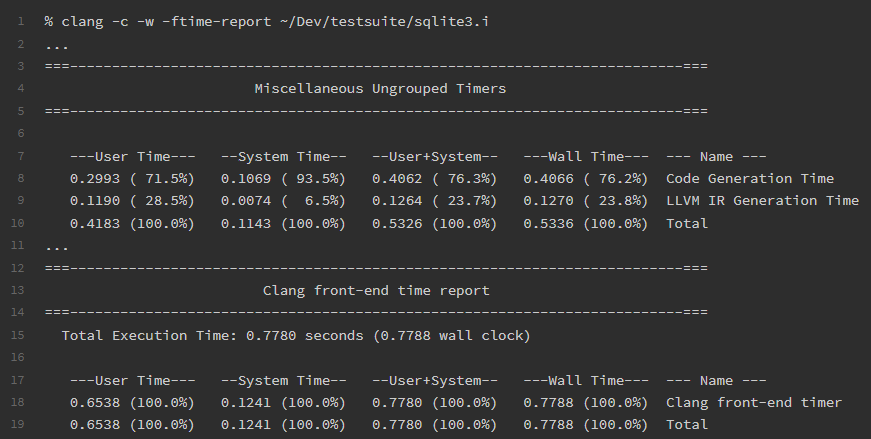
The "Clang front-end timer" timer measured the time spent in clang::FrontendAction::Execute, which includes lexing, parsing, semantic analysis, LLVM IR generation, optimization, and machine code generation. However, "Code Generation Time" and "LLVM IR Generation Time" belonged to the default timer group "Miscellaneous Ungrouped Timers". This caused confusion for many users. For example, https://aras-p.info/blog/2019/01/12/Investigating-compile-times-and-Clang-ftime-report/ elaborates on the issues.
Add a Comment
Comments are closed.